


Free Online Forex Risk Percentage Calculator, Per Trade, Cash & Account
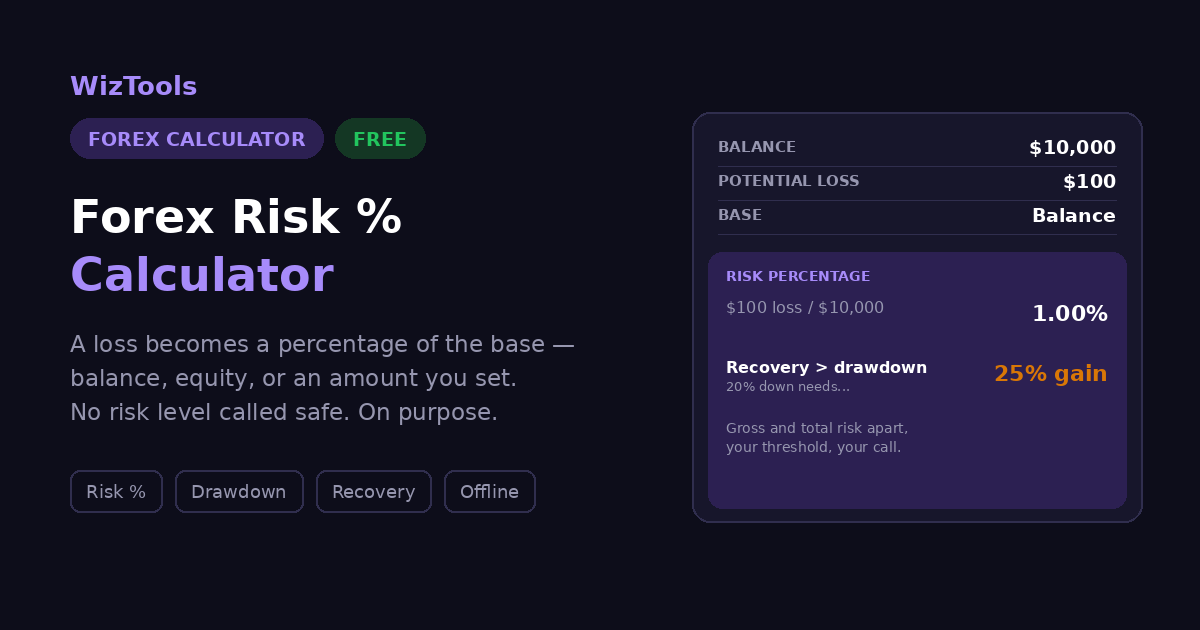
Turn a risk rule into real numbers. Enter your balance and the percentage you risk per trade, and see the cash amount, what a losing streak would do to the account, and how long it would take to recover. It makes the difference between one and two percent very concrete.
Broker and instrument assumptions
📊 Risk percentage
Trade risk as a percent of the base.
Set the balance, risk base and the trade at the top of the app. This tab shows the potential loss, the risk percentage, the total estimated risk including costs, and the remaining balance, all from the same engine.
💰 Risk amount
Money at risk from a percentage.
The money at risk from the risk percentage and your chosen base, so risk = base × risk % ÷ 100.
📦 Position risk
Loss and risk % for a position.
The potential loss and risk percentage for the position, stop and pip value at the top of the app.
🛑 Stop-loss risk
Risk from a stop price or pips.
The risk from a stop given as a price or a distance in pips, so the stop pips, potential loss and risk percentage.
🔄 Drawdown recovery
The gain needed to get back.
The drawdown and the gain needed to recover it — the required gain is always larger than the drawdown.
⚖️ Risk / reward
Risk and reward as money and %.
Risk and reward as pips, money and percent, and the risk/reward ratio, from your entry, stop and take-profit.
📊 Portfolio risk
Combined risk across positions.
Pick the position sizes you are running in this pair. Each uses the current stop and pip value, and the combined risk, portfolio percentage and remaining capacity against your threshold are shown.
| Position | SL pips | Risk amount | Risk % |
|---|
📋 Multiple trades
Risk across several trades.
Risk across the position sizes you pick, with the potential loss and risk percentage per trade, plus the total, average, highest and lowest.
| Position | SL pips | Potential loss | Risk % |
|---|
📊 Risk comparison
Risk amount across percentages.
The risk amount and remaining balance across a range of risk percentages, from your chosen base. No percentage is recommended.
| Risk % | Risk amount | Remaining balance |
|---|
📉 Drawdown impact
Balance after losses, compounded.
A run of consecutive losses at your risk percentage, each taken on a smaller balance. The balance after each loss and the cumulative drawdown are shown. A mathematical scenario, not a prediction.
| Trade | Starting | Loss | Ending | Cumulative DD |
|---|
📊 Scenario analysis
Risk across stops and sizes.
Two tables from your current trade: how the potential loss and risk change across stop distances, and across position sizes. Neither is a recommendation.
| Stop | Potential loss | Risk % |
|---|
| Position | Potential loss | Risk % |
|---|
📝 Trade summary
The whole risk picture on a card.
The whole risk picture on one card: balance, base, risk %, potential loss, total estimated risk and remaining balance. Copy it in one click.
| When | Calculator | Result | Actions |
|---|
Number formatting
Rounding only changes what you see; the arithmetic keeps full precision, and a value within tolerance of zero shows as $0.00.
Appearance
History
Your data
Settings, history, saved setups and any custom pairs are stored only in this browser. Nothing is uploaded, and this tool has no field for a trading login, a broker password or an API key. Never type one into any calculator.
Enjoying WizTools123? Help keep our server infrastructure 100% free and open for everyone.
How to Calculate Forex Risk Percentage
Five steps, and none of them involve a server.
The risk base is what the percentage is measured against: account balance, current equity, or a custom amount. Every risk figure ties back to it.
Enter a position, stop and pip value for a trade-based risk, or a risk percentage for the risk amount directly. The tool fills in the rest from the same engine.
The stop distance times the pip value is the price-based loss; against the base it is the risk percentage; costs are added separately for the total.
Set your own threshold and the tool reports whether the calculated risk is above or below it — a comparison against your setting, never a safe-or-unsafe verdict.
See how consecutive losses compound the balance down, and how much larger a gain is needed to recover than the drawdown that caused it.
From Loss to Percentage to Total
A $10,000 balance, a 50-pip stop, 0.20 lots, $11 of costs.
| Step | Value |
|---|---|
| Potential loss (50 pips × $2) | $100.00 |
| Risk % ($100 ÷ $10,000) | 1.00% |
| Trading costs (spread + comm + swap) | $11.00 |
| Total estimated risk ($100 + $11) | $111.00 |
| Total risk % ($111 ÷ $10,000) | 1.11% |
| Remaining balance ($10,000 − $111) | $9,889.00 |
The price-based risk is the stop distance in pips times the pip value — 1% here. The trading costs are added separately to give a total estimated risk of 1.11%, never blended in silently, so you always know which percentage is which. And every figure is measured against the base you chose: against $8,000 of equity instead of the $10,000 balance, the same $100 loss would read 1.25%, not 1%.
How Many Losses Before You Hit a Limit?
Against a 5% daily loss limit and a 10% maximum drawdown, both common on funded accounts.
| Risk per trade | Losses to the 5% daily limit | Losses to the 10% maximum | Room |
|---|---|---|---|
| 0.25% | 20 in a row | 40 in a row | Workable |
| 0.50% | 10 in a row | 20 in a row | Workable |
| 1.00% | 5 in a row | 10 in a row | Workable |
| 1.50% | 3 in a row | 6 in a row | Workable |
| 2.00% | 2 in a row | 5 in a row | Almost none |
| 3.00% | 1 in a row | 3 in a row | Almost none |
| 5.00% | 1 in a row | 2 in a row | Almost none |
This is only division, and that is exactly why it is worth putting on the page. At
1% a trader has
5 losing trades before the daily limit and
10 before the account is gone, which is enough room for an
ordinary bad run. At 3% it is one trade to the daily limit and three to the end. Nobody plans to lose
three in a row, and everybody does eventually.
The trap in a funded account is that the limits are not yours to negotiate. On your own money a bad week
is unpleasant and you carry on. On a funded account, touching the drawdown line ends the account
regardless of how good the analysis was, so the risk that works out over a hundred trades is irrelevant if
it cannot survive the worst five. That is the reason so many funded traders sit at
0.50% or lower, and it is arithmetic rather than
timidity.
Two things this table deliberately does not do. It does not recommend a risk level, because the
right number depends on your strategy, your win rate and rules only you can see. And the
5% and 10% here are common
examples rather than a standard: firms differ on the size of the limits, on whether the drawdown is
static or trailing, on whether it is measured against balance or equity, and on whether an open floating
loss counts. Those differences change the answer materially, so read your own rules and put your own
numbers into the calculator above.
The Formulas, With Worked Numbers
A $10,000 account, a 50-pip stop, a 20% drawdown.
| What | Formula | Worked example |
|---|---|---|
| Risk amount | Risk = Risk base × Risk % ÷ 100 | $10,000 × 1% = $100 |
| Risk percentage | Risk % = Risk amount ÷ Risk base × 100 | $100 ÷ $10,000 = 1% |
| Stop-loss pips | SL pips = SL distance ÷ Pip size | 0.00500 ÷ 0.0001 = 50 pips |
| Potential loss | Loss = SL pips × Pip value | 50 × $2 = $100 |
| Total estimated risk | Total = Loss + Spread + Comm + Swap + Other | 100 + 5 + 4 + 2 = $111 |
| Total risk percentage | Total % = Total risk ÷ Risk base × 100 | $111 ÷ $10,000 = 1.11% |
| Remaining balance | Remaining = Risk base − Total risk | $10,000 − $111 = $9,889 |
| Drawdown | DD % = (Start − Current) ÷ Start × 100 | (10,000 − 8,000) ÷ 10,000 = 20% |
| Recovery gain | Gain % = (Start − Current) ÷ Current × 100 | (10,000 − 8,000) ÷ 8,000 = 25% |
| Sequential loss | Each: New = Current − Current × Risk % ÷ 100 | $10,000 → 5 × 2% → $9,039.21 |
| Risk / reward | Ratio = Reward ÷ Risk | $200 ÷ $100 = 1 : 2 |
Things Worth Knowing
The assumptions behind every number on this page.
What This Calculator Does
And, just as importantly, what it refuses to assume.
A percentage into a risk amount, or a risk amount into a percentage, against the balance, the equity or a custom base you choose.
The stop distance gives the price-based loss; spread, commission and swap are added separately for a total estimated risk, never blended silently.
Consecutive losses compounded trade by trade, and the gain needed to recover, always shown as larger than the drawdown that caused it.
Combined risk across several positions with the portfolio percentage, and the remaining risk capacity against a limit you set.
No risk level is called safe or unsafe. Set your own threshold and the tool simply reports above or below, which is a mathematical comparison and nothing more.
No account, no upload, no live feed. Settings, history and saved setups live in this browser and nowhere else.
About the Forex Risk Percentage Calculator
Risk in forex is easiest to reason about as a percentage: not "I might lose $100" but "I am risking 1% of the account". A percentage is comparable across account sizes and across trades, and it is the number most risk rules are written in. This calculator turns the pieces of a trade, the stop distance, the pip value and the position size, into that percentage, and turns a percentage back into the money it represents.
Everything hangs on the base. The risk percentage is the potential loss divided by whatever you are measuring against, and that base can be the account balance, the current equity, or a custom amount. The same loss is a different percentage against each, so the tool makes the base an explicit choice rather than a hidden assumption, and every figure on the page, from risk amount to total risk to remaining balance, is computed against the base you selected.
Costs are kept honest and separate. The stop distance times the pip value is the price-based loss, and spread, commission and swap are added on top to give a total estimated risk, each with a toggle so you can see its effect. Gross and total are never blended silently, and when a percentage is shown it is always clear which of the two it rests on. Pip value is treated as a real input rather than an assumed $10, and where the account and quote currencies differ, a conversion rate is asked for instead of invented.
Beyond a single trade, the tool looks at the shape of risk over time. Portfolio risk combines several positions into one percentage and shows the remaining capacity against a limit you set. Drawdown works consecutive losses through step by step, compounding each on a smaller balance, and recovery shows the uncomfortable truth that getting back always takes a larger gain than the drawdown that caused it — 25% to recover a 20% loss, 100% to recover a 50% one.
What the tool is careful not to do is judge. It never calls a risk level safe or unsafe, good or bad, ideal or reckless. The only comparison it offers is against a threshold you define yourself, and even then it just reports above or below. Risk tolerance is personal, and the tool treats it as yours to set.
It also does not fetch a live price or rate, assume a broker's costs, or recommend a trade, a size or a risk level. It works out the risk and the percentages from the numbers you enter, keeps the price loss and the costs apart, and shows its working.
Frequently Asked Questions
The questions that come up most often about forex risk percentage.