


Free Online Crypto Liquidation Price Calculator, Long, Short & Leverage
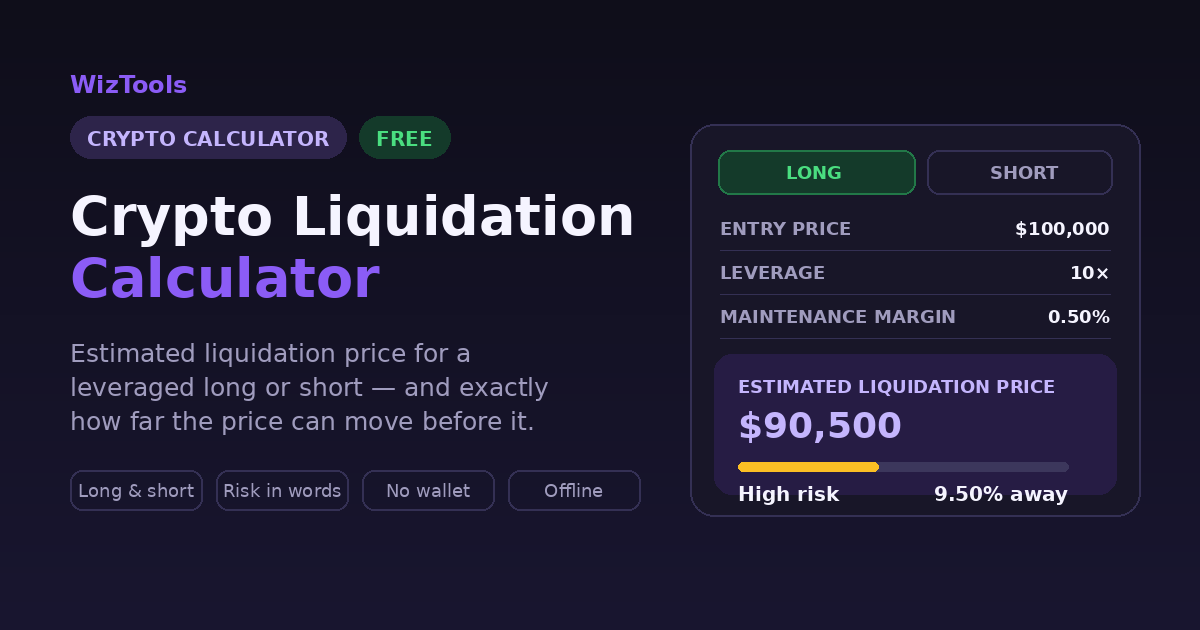
Find the price where a leveraged position gets closed for you. Enter your entry, leverage and margin for a long or a short, and the liquidation price comes out with the distance from your entry in percent. Adding margin moves the level, and you can see exactly how far it moves.
Liquidation calculations are estimates. Actual liquidation prices vary by exchange, maintenance margin, fees, funding and liquidation rules. Everything is worked out locally in your browser.
These come out of the margin backing the position, which lowers the effective leverage and moves the estimated level. They are kept out of the basic sum until you fill them in.
An estimate from a simplified isolated-margin model. Your exchange's figure is the one that counts, so check it there before you open the position.
Long position
Profit, loss and the liquidation level for a long.
Short position
Profit, loss and the liquidation level for a short.
Position size
The largest position a margin balance supports.
Initial margin
The margin a position of a given size and leverage needs.
Leverage
The leverage implied by a position and the margin behind it.
Margin call check
How healthy a position is at the price it is trading at now.
Liquidation distance
How far the price can move before the estimated level.
Add margin
What topping up the margin does to the estimate.
Reduce position
What closing part of the position does to the estimate.
Multiple positions
Several positions in one table, each with its own level. Each position keeps its own estimated level, and they are not netted against one another.
| # | Asset | Side | Entry | Current | Quantity | Leverage | MMR | Liquidation | P/L | Remove |
|---|
Price scenarios
The position at several hypothetical prices. These are hypothetical, and nothing here is a forecast.
| Price | Remove |
|---|
| Market price | P/L | P/L % | To liquidation |
|---|
| When | Calculator | Inputs | Result | Actions |
|---|
Calculator
Numbers
Rounding is only ever applied to what you see. The arithmetic underneath keeps full precision, which matters when a position is measured in satoshis.
Currency
A display unit only. No exchange rate is applied, so switching currency changes the symbol, not the numbers. Enter every figure in the currency your contract settles in.
Results
Appearance
History
Your data
Settings, history and saved positions are stored only in this browser. Nothing is uploaded, and this tool has no field for a wallet address, an API key, a private key or a seed phrase. Never type one into any calculator.
Enjoying WizTools123? Help keep our server infrastructure 100% free and open for everyone.
How to Use the Liquidation Calculator
Six steps, and the last one matters most.
A long is liquidated when the price falls, a short when it rises. The whole formula flips on this one choice, so it comes first.
Entry price, and either the position value or the quantity, whichever your exchange shows you. The other one is worked out for you.
Use the slider or type it. The estimated level moves as you drag, which is the quickest way to see what leverage actually costs you in room to be wrong.
The 0.5% default is a common starting figure, not a universal one. Your exchange publishes its own rate, and it rises with position size, so use theirs.
Optional. It turns the estimate into a distance, a profit or loss, and a risk reading in words.
Open the position on your exchange and compare its liquidation price with this one. If they disagree, the exchange is right. It is the one that will close the position.
How to Avoid Liquidation
A 100,000 long at 10× with a 0.5% maintenance margin, changed one thing at a time.
| What you change | The change | Liquidation | Room you get | The catch |
|---|---|---|---|---|
| Nothing, as it stands | 10× with 0.5% maintenance margin | 90,500 | 9.50% | This is your starting point. |
| Halve the leverage | Down to 5× | 80,500 | 19.50% | You must post twice the margin for the same position. |
| Double the margin | Same position, twice the collateral | 80,500 | 19.50% | Identical to halving the leverage. It is the same arithmetic. |
| Halve the position | Same margin, half the size | 80,500 | 19.50% | Also identical. Your profit halves with it. |
| Raise the leverage | Up to 20× | 95,500 | 4.50% | Half the room, for the same position size. |
| Set a stop loss | At any price you choose | 90,500 | 9.50% | It does not move the level at all. It gets you out before it, which is a different thing. |
Three of those rows land on exactly the same number, and that is not a coincidence. Halving the leverage,
doubling the margin and halving the position are one adjustment wearing three different names: in every
case your own money doubles relative to the position, so the price has to travel twice as far to consume
it. Advice that lists them as three separate tips is really giving you one tip three times.
The last row is the one worth pausing on, because it is stated wrongly almost everywhere. A stop loss does
not move your liquidation price by a single dollar. It closes the position before that level, which is a
genuinely good reason to use one, and it is a different claim. In a fast gap a stop can also fill well past
where you set it, and the liquidation level sits there unchanged the whole time. The only thing that really
moves it is putting up more of your own money against a smaller position, which is the unglamorous answer
people are usually hoping to avoid.
The Formulas, Step by Step
A $100,000 long at 10× with a 0.5% maintenance margin, worked all the way through.
| Figure | Formula | Worked example |
|---|---|---|
| Position value | Entry price × Quantity |
$100,000 × 0.1 = $10,000 |
| Initial margin | Position value ÷ Leverage |
$10,000 ÷ 10 = $1,000 |
| Leverage | Position value ÷ Initial margin |
$10,000 ÷ $1,000 = 10× |
| Maximum position | Margin × Leverage |
$1,000 × 10 = $10,000 |
| Quantity | Position value ÷ Entry price |
$10,000 ÷ $100,000 = 0.1 |
| Liquidation — long | Entry × (1 − 1 ÷ Leverage + MMR) |
$100,000 × (1 − 0.1 + 0.005) = $90,500 |
| Liquidation — short | Entry × (1 + 1 ÷ Leverage − MMR) |
$100,000 × (1 + 0.1 − 0.005) = $109,500 |
| Distance in money | | Entry − Liquidation | |
$100,000 − $90,500 = $9,500 |
| Distance in per cent | Distance ÷ Entry × 100 |
$9,500 ÷ $100,000 × 100 = 9.50% |
| Distance from now | | Current − Liquidation | ÷ Current × 100 |
$4,500 ÷ $95,000 × 100 = 4.74% |
| Profit or loss — long | (Current − Entry) × Quantity |
($95,000 − $100,000) × 0.1 = −$500 |
| Profit or loss — short | (Entry − Current) × Quantity |
($100,000 − $95,000) × 0.1 = +$500 |
| Return on margin | Profit ÷ Initial margin × 100 |
−$500 ÷ $1,000 × 100 = −50% |
| Effective leverage | Position value ÷ Margin after adjustments |
$10,000 ÷ $1,500 = 6.67× |
| Margin level | Equity ÷ Maintenance margin × 100 |
$500 ÷ $50 × 100 = 1,000% |
These are the simplified isolated-margin formulas. The engine is built so that exchange-specific models can be added beside them rather than replacing them, but none are included, because a maintenance-margin tier that has gone stale is worse than no preset at all.
How Much Room Each Leverage Leaves You
A long with a 0.5% maintenance margin. The last column is the one worth reading twice.
| Leverage | Estimated level on a $100,000 entry | Move that reaches it |
|---|---|---|
| 2× | $50,500 | 49.50% below the entry |
| 5× | $80,500 | 19.50% below the entry |
| 10× | $90,500 | 9.50% below the entry |
| 20× | $95,500 | 4.50% below the entry |
| 25× | $96,500 | 3.50% below the entry |
| 50× | $98,500 | 1.50% below the entry |
| 100× | $99,500 | 0.50% below the entry |
| 125× | $99,700 | 0.30% below the entry |
Bitcoin moving 2% within an hour is unremarkable. Read that against the bottom rows of this table rather than the top ones. It is the whole reason high leverage is closed by ordinary volatility rather than by being wrong about the direction.
What These Numbers Do and Do Not Mean
The parts that cost people money when they are misread.
Key Features & Capabilities
A calculator that shows its working and names its model.
The formula flips with the position, so a short shows its estimated level above the entry price where it belongs, a detail a surprising number of calculators get backwards.
A simplified isolated-margin estimate, said plainly on every result. No exchange rules are hardcoded, because tiered maintenance margin changes and a stale tier is worse than no number.
The meter always prints the band name and the actual percentage distance, so it still reads correctly in greyscale or with any form of colour blindness.
Liquidation price, long, short, position size, margin, leverage, margin call, distance, adding margin, reducing a position, several positions at once, and price scenarios.
Advanced adjustments take fees, funding and extra margin out of the margin backing the position and re-estimate the level, and they are kept out of the basic sum until you turn them on.
Calculation details expands into every line of the sum with your own numbers in it, and names the model it used, so you can check the result rather than trust it.
A setup you check often can be saved by name, and recent work is kept automatically, all in your own browser.
Nothing to connect and nothing to sign into. No price is fetched, so the tool works offline and no request carries anything about your positions.
About the Crypto Liquidation Calculator
A liquidation price is the one number a leveraged trader should know before opening a position and often works out afterwards. It is the price at which the exchange closes the trade because the loss has eaten through the margin, and the arithmetic behind it is not complicated: a long at 10× is liquidated roughly 10% below the entry, a short at 10× roughly 10% above it, adjusted for whatever maintenance margin the exchange holds back.
What makes that number worth calculating is the comparison it invites. Ten per cent sounds like room. Two per cent, which is where 50× puts you, is an ordinary hour on a quiet day in crypto. Putting the distance in front of you, in money and in per cent, next to the position you were actually thinking about turns leverage from an abstract multiplier into a concrete question: how far can this move before I am out, and does the asset move that far routinely?
This calculator handles both directions, both margin modes, and the questions that follow: what a margin top-up does to the level, what closing part of the position does, how several positions look side by side, and where the position stands at a range of hypothetical prices. Around that sit the ordinary sums: position value, initial margin, effective leverage, profit and loss, return on margin, each shown with its working.
What it will not do is pretend to be your exchange. The model here is the standard simplified isolated-margin one, and it is labelled as an estimate on every result. Real exchanges use tiered maintenance margin that rises with position size, liquidate against a smoothed mark price rather than the last trade, and deduct fees and funding from your margin as the position ages. Any of those can move the real level. Hardcoding one exchange's tiers would look more authoritative and be quietly wrong within a month, and on a leveraged position a wrong liquidation price is not a small error. Use this to understand the shape of the risk, then read the actual number off the exchange that will be doing the liquidating.
Frequently Asked Questions
The questions behind the questions.