


Free Online Crypto Leverage Calculator, Margin, Exposure & Risk
See what leverage really does to a position. Enter your margin and the leverage, and get the total exposure, the price move that would double your money and the move that would wipe it out. The numbers make clear how little the market has to move against a large multiplier.
Leverage can amplify both gains and losses. Calculations are estimates and actual exchange results may differ. Everything is worked out locally in your browser.
| Leverage | Price up | Price down |
|---|
Position size
The position a margin balance supports at a given leverage.
Required margin
The margin a position of a given size and leverage needs.
Leveraged profit and loss
What a move is worth once leverage, fees and funding are counted.
Return on margin
The difference between a price move and what it did to your margin.
Estimated liquidation price
Roughly where a leveraged position would be closed.
An estimate from a simplified isolated-margin model. Enough to judge a leverage, not enough to trade against. For margin top-ups, partial closes and cross margin, the liquidation calculator goes further, and your exchange goes further still.
Risk and reward
What the stop loss risks against what the target pays.
Maximum loss and sizing
A position size worked back from the loss you are willing to take.
Add margin or reduce size
What either one does to your effective leverage.
Leverage comparison
The same margin at every leverage, side by side.
| Leverage | Margin | Position | 1% move | 5% move | Room to liquidation |
|---|
Price movement scenarios
The position across a range of hypothetical moves. These are hypothetical, and nothing here is a forecast.
| Move | Market price | Profit / loss | Return on margin | Status |
|---|
Multiple positions
Several positions in one table, with the totals underneath.
| # | Asset | Side | Entry | Current | Position size | Leverage | Margin | P/L | Remove |
|---|
| When | Calculator | Inputs | Result | Actions |
|---|
Calculator
Numbers
Rounding is only ever applied to what you see. The arithmetic underneath keeps full precision, which matters when a position is measured in satoshis.
Currency
A display unit only. No exchange rate is applied, so switching currency changes the symbol, not the numbers. Enter every figure in the currency your contract settles in.
Results
Appearance
History
Your data
Settings, history and saved calculations are stored only in this browser. Nothing is uploaded, and this tool has no field for a wallet address, an API key, a private key or a seed phrase. Never type one into any calculator.
Enjoying WizTools123? Help keep our server infrastructure 100% free and open for everyone.
How to Use the Leverage Calculator
Six steps, and nothing leaves your browser.
Position size, initial margin and leverage sit in one triangle. Enter any two and the third appears. The one being worked out is marked so you always know which number is yours and which is the answer.
Drag from 1× to 125× and watch the margin, the room to liquidation and the leverage band change together. This is the fastest way to feel what leverage actually costs you in space to be wrong.
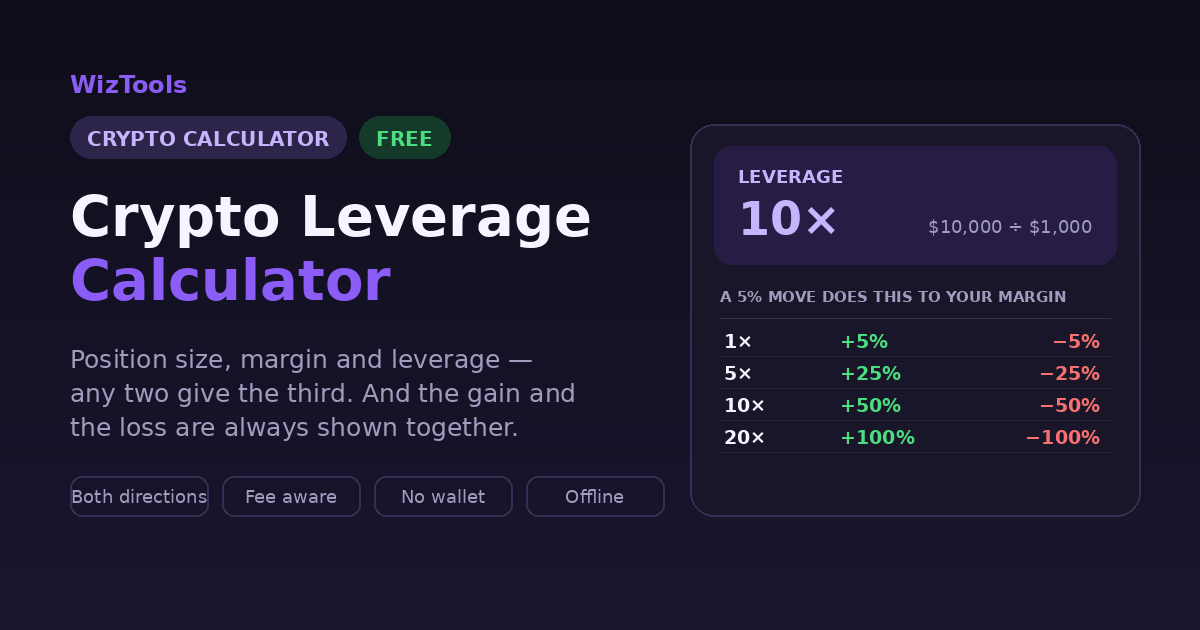
The same price move, shown against several leverages. A 5% move is +5% at 1× and +100% at 20× — and it is exactly as true on the way down, which the table shows in the same breath.
Entry fee, exit fee and funding are charged on the position, not on your margin, so a rate that looks tiny is not. The profit-and-loss tab takes all three off before it shows a number.
The maximum loss tab works the other way round: decide what you are willing to lose, and it gives the position that fits. It is arithmetic, not advice.
The estimate here is enough to judge a leverage. For the real work of margin top-ups, partial closes and cross margin, the dedicated liquidation calculator goes deeper, and your exchange goes deeper still.
What Leverage Should You Use?
Read it as how much room you have left, not as a menu.
| Leverage | Margin needed | A 1% move is | Margin gone at | In practice |
|---|---|---|---|---|
| 1× | 100.00% of the position | 1% of your margin | 100.00% against you | More than 25% of movement is needed before the margin is gone. A 1× position is simply spot with extra steps. |
| 2× | 50.00% of the position | 2% of your margin | 50.00% against you | More than 25% of movement is needed before the margin is gone. A 1× position is simply spot with extra steps. |
| 3× | 33.33% of the position | 3% of your margin | 33.33% against you | More than 25% of movement is needed before the margin is gone. A 1× position is simply spot with extra steps. |
| 5× | 20.00% of the position | 5% of your margin | 20.00% against you | Between 10% and 25% of movement wipes the margin. That is a bad week in crypto, not a bad hour. |
| 10× | 10.00% of the position | 10% of your margin | 10.00% against you | Between 4% and 10% of movement wipes the margin, which is inside a single ordinary day for most coins. |
| 20× | 5.00% of the position | 20% of your margin | 5.00% against you | Between 4% and 10% of movement wipes the margin, which is inside a single ordinary day for most coins. |
| 50× | 2.00% of the position | 50% of your margin | 2.00% against you | Under 2% of movement wipes the margin. At this level ordinary volatility closes the position, not being wrong about direction. |
Two columns in that table are the same number, and that is the whole lesson. The margin a position needs
as a percentage is also, near enough, how far the price can travel against you before that margin is gone.
At 10× you are putting up 10% and you have 10% of room. At 50× you are putting up 2% and you
have 2% of room, which Bitcoin covers in an unremarkable hour, so at that level ordinary movement closes
the position rather than you being wrong about direction.
One honest correction to the table: those figures are the outer limit, not the real one. Exchanges
hold a maintenance margin, so liquidation arrives before your margin reaches zero, and fees and funding
are taken out along the way, which brings it closer still. Treat every number here as slightly optimistic,
work out the real liquidation price with the calculator above, and then check it against the exchange that
will actually be doing the liquidating.
The Formulas, Step by Step
A $10,000 position on $1,000 of margin, worked all the way through.
| Figure | Formula | Worked example |
|---|---|---|
| Leverage | Position size ÷ Initial margin |
$10,000 ÷ $1,000 = 10× |
| Position size | Initial margin × Leverage |
$1,000 × 10 = $10,000 |
| Required margin | Position size ÷ Leverage |
$20,000 ÷ 20 = $1,000 |
| Margin requirement | 100 ÷ Leverage |
100 ÷ 20 = 5% |
| Quantity | Position size ÷ Entry price |
$5,000 ÷ $100 = 50 |
| Profit or loss — long | (Exit − Entry) × Quantity |
($110 − $100) × 100 = $1,000 |
| Profit or loss — short | (Entry − Exit) × Quantity |
($100 − $90) × 100 = $1,000 |
| Return on margin | Profit ÷ Initial margin × 100 |
$250 ÷ $1,000 × 100 = 25% |
| Margin return from a move | Price change % × Leverage |
5% × 20 = 100% |
| Trading fee | Position size × Fee % ÷ 100 |
$10,000 × 0.05 ÷ 100 = $5 |
| Funding cost | Position size × Rate % ÷ 100 × Periods |
$10,000 × 0.01% × 3 = $3 |
| Liquidation — long | Entry × (1 − 1 ÷ Leverage + MMR) |
$100 × (1 − 0.1 + 0.005) = $90.50 |
| Liquidation — short | Entry × (1 + 1 ÷ Leverage − MMR) |
$100 × (1 + 0.1 − 0.005) = $109.50 |
| Risk per unit | | Entry − Stop loss | |
$100 − $90 = $10 |
| Reward per unit | | Take profit − Entry | |
$130 − $100 = $30 |
| Risk to reward | Reward ÷ Risk |
$30 ÷ $10 = 1 : 3 |
| Position size from risk | (Account × Risk %) ÷ Risk per unit × Entry |
($10,000 × 1%) ÷ $5 × $100 = $2,000 |
What Each Leverage Actually Does
$1,000 of margin, and a 5% move in either direction. The last column is the one worth reading twice.
| Leverage | Position | Margin requirement | 5% up | 5% down | Move that wipes the margin |
|---|---|---|---|---|---|
| 1× | $1,000 | 100% | +5% | −5% | 100% against you |
| 2× | $2,000 | 50% | +10% | −10% | 50% against you |
| 3× | $3,000 | 33.33% | +15% | −15% | 33.33% against you |
| 5× | $5,000 | 20% | +25% | −25% | 20% against you |
| 10× | $10,000 | 10% | +50% | −50% | 10% against you |
| 20× | $20,000 | 5% | +100% | −100% | 5% against you |
| 50× | $50,000 | 2% | +250% | −250% | 2% against you |
The margin requirement and the move that wipes the margin are the same number, which is not a coincidence: the margin you post is exactly the cushion you have. Bitcoin covering 2% inside an hour is unremarkable. Read that against the bottom rows rather than the top ones.
What These Numbers Do and Do Not Mean
The parts that cost people money when they are misread.
Key Features & Capabilities
A calculator that shows its working.
Position size, margin and leverage solved in whichever direction you have the numbers, with the derived field marked rather than silently overwritten.
Every leverage figure is shown as a gain and as a loss in the same table. The arithmetic is symmetric and the presentation is too.
The leverage band prints its name and the actual percentage of room left, so it reads correctly in greyscale and explains itself rather than just colouring in.
Entry fee, exit fee and funding across as many periods as you like, charged on the position value the way an exchange charges them.
Start from the loss you will accept and get the position that fits, with a warning when that size needs more margin than you have.
Calculation details expands into every line of the sum with your own numbers in it, so you can check the result rather than trust it.
A configuration you check often can be saved by name, and recent work is kept automatically, all in your own browser.
Nothing to connect and nothing to sign into. No price is fetched, so the tool works offline and no request carries anything about your positions.
About the Crypto Leverage Calculator
Leverage is one equation wearing several hats. Position size equals margin times leverage, and every question people ask about a leveraged trade: how much margin do I need, how big a position can I take, what is my real exposure, is that same equation rearranged. This calculator takes any two of the three and gives you the third, then keeps going into the questions that follow.
The one that matters most is rarely asked out loud: what does a small move do to my margin? At 1× a 5% move is a 5% return. At 20× the same 5% move returns 100% — and a 5% move the other way takes the entire margin. That symmetry is the whole story of leverage, and it is why the impact table here always prints the gain and the loss together rather than leading with the pleasant one.
Around that sit the working parts: required margin and margin requirement as a percentage, profit and loss with entry fee, exit fee and funding taken off, return on margin shown next to the underlying price move so the two never get confused, a comparison table putting the same balance at every leverage side by side, price scenarios from −20% to +20%, and a risk-first sizing tool that starts from the loss you are willing to accept rather than from the leverage you fancy.
What the tool will not do is tell you what leverage to use. The bands it displays, from low through moderate and high to very high and extreme, are descriptions of how much room the arithmetic leaves you, not recommendations, and they are labelled that way on the page. There is a liquidation estimate here too, because judging a leverage without one is guesswork, but it is the simplified isolated-margin model and it says so on every result; the dedicated liquidation calculator handles the deeper cases, and your exchange handles the real one. Everything runs in your browser: no price is fetched, no account is needed, and nothing you type leaves the device.
Frequently Asked Questions
The questions behind the questions.
Related Tools
Every Other Crypto Tool
11 more tools in this set. All free, all in your browser.