


Free Online Forex Pivot Point Calculator, Classic, Fibonacci, Camarilla & Woodie
Work out pivot points from yesterday high, low and close. Five methods are calculated side by side, classic, Fibonacci, Camarilla, Woodie and DeMark, so you can see how far apart they place the same support and resistance levels. They are reference points, not signals.
Everything runs in your browser. No prices are fetched and nothing you type is sent anywhere.
📐 Classic pivot points
The original, and still the most watched.
The original method and by far the most widely plotted, which is the main argument for it: more people are looking at these lines than at any other set.
P = (H + L + C) ÷ 3
Levels produced: 7. Set the pair, period and prices at the top of the app, and they apply to every tab here.
🪵 Woodie pivot points
Closing price counted twice.
Weights the closing price twice, so the pivot sits nearer where the session finished rather than in the middle of its range. On a day that closed far from its midpoint, Woodie and Classic can be a long way apart.
P = (H + L + 2C) ÷ 4
Levels produced: 5. Set the pair, period and prices at the top of the app, and they apply to every tab here.
🎯 Camarilla pivot points
Eight levels, all packed near the close.
Builds eight levels out from the close using fractions of the range, so they cluster far more tightly than the other methods. Popular with intraday traders for that reason, and unhelpful on a very quiet session, where every level lands within a few pips.
R1 = C + (H − L) × 1.1 ÷ 12
Levels produced: 8. Set the pair, period and prices at the top of the app, and they apply to every tab here.
🌀 Fibonacci pivot points
The range split by Fibonacci ratios.
Uses the Classic pivot and then places supports and resistances at Fibonacci fractions of the range. It shares its centre with Classic and disagrees with it everywhere else.
R1 = P + (H − L) × 0.382
Levels produced: 7. Set the pair, period and prices at the top of the app, and they apply to every tab here.
📊 DeMark pivot points
One support and one resistance only.
The odd one out. It produces a single support and a single resistance rather than a ladder, and which formula it uses depends on where the session closed relative to its open, so it needs the open price as well.
Depends on close against open
Levels produced: 3. Set the pair, period and prices at the top of the app, and they apply to every tab here.
⚖️ All methods side by side
The same session, five different answers.
The same three prices through all five methods. The widest and tightest sets are marked, and no method is ranked, because none of them is more correct than the others.
| Method | R2 | R1 | Pivot | S1 | S2 | R1 to S1 |
|---|---|---|---|---|---|---|
| Enter a high, low and close, then press Calculate. | ||||||
📏 Distance to each level
How far price sits from every level, in pips.
Enter the current price in the bar above and every level gains a distance in pips. A level forty pips away and one that is two pips away are very different things, and the level itself does not tell you which it is.
| Level | Price | Distance | Side |
|---|---|---|---|
| Add a current price to see distances. | |||
🕯️ Range and midpoint
What the session itself did, before any pivot.
Before any pivot method is applied, the session itself is worth looking at. The range sets how far apart every level will end up, and where the close sits inside that range is what makes Woodie and Classic differ.
🕘 Calculation history
Recent sessions, kept on this device.
| When | Pair and period | Prices | |
|---|---|---|---|
| Sessions you calculate appear here, kept in this browser only. | |||
⭐ Saved sessions
The setups you come back to.
Auto follows the pair: five decimals on most, three on yen pairs, two on gold. Override it if your platform shows something else.
Settings, history and saved sessions are stored only in this browser. Nothing is uploaded, and this tool has no field for a trading account login, a broker password or an API key. Never type one into any calculator.
Enjoying WizTools123? Help keep our server infrastructure 100% free and open for everyone.
How to Use the Pivot Point Calculator
Three prices in, five sets of levels out.
The Five Methods Disagree, and That Is the Point
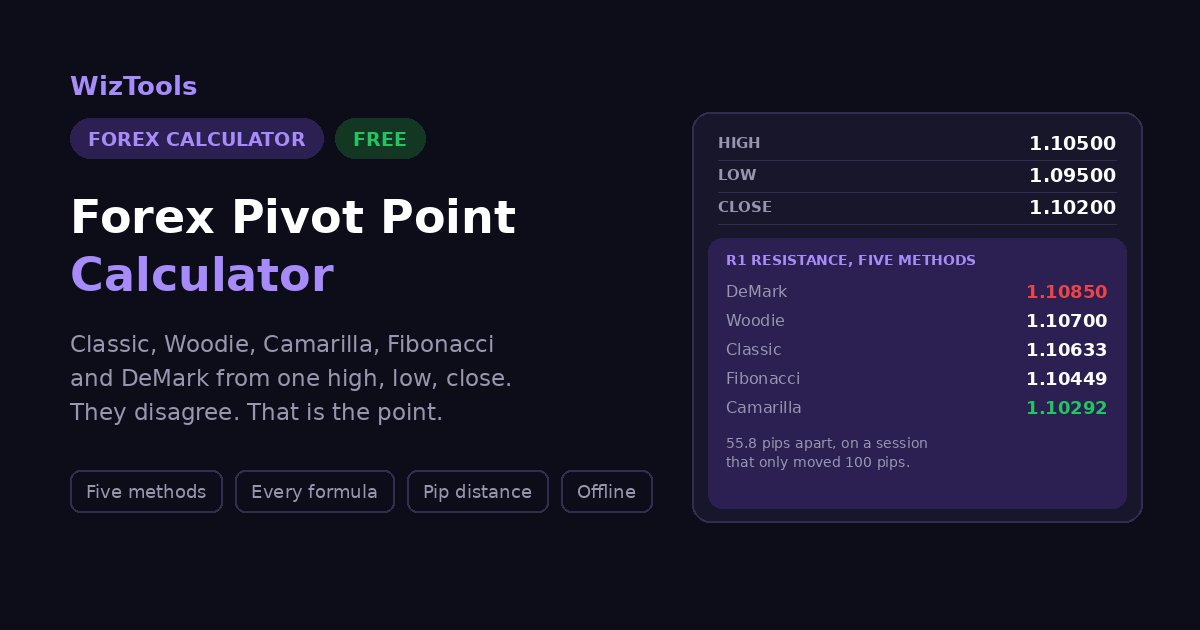
One session: high 1.1050, low 1.0950, close 1.1020, open 1.0980. A range of 100 pips.
| Method | Pivot | R1 | S1 | R1 to S1 |
|---|---|---|---|---|
| Classic | 1.10067 | 1.10633 | 1.09633 | 100.0 pips |
| Woodie | 1.10100 | 1.10700 | 1.09700 | 100.0 pips |
| Camarilla | 1.10067 | 1.10292 | 1.10108 | 18.3 pips |
| Fibonacci | 1.10067 | 1.10449 | 1.09685 | 76.4 pips |
| DeMark | 1.10175 | 1.10850 | 1.09850 | 100.0 pips |
Every row above came from that one session, and only DeMark looked at the open. The R1 levels land
55.8 pips apart from each other, and the S1
levels 47.5 pips apart. On a session that only moved
100 pips in total, that is a very large disagreement about
where resistance is. DeMark puts R1 highest and
Camarilla puts it lowest, and both are calculated correctly.
The last column shows something else worth knowing. Classic, Woodie and DeMark always span exactly the
session range between R1 and S1, because the arithmetic works out that way whatever prices you feed them.
Camarilla is the outlier at
18.3 pips, since it builds its levels from
fractions of the range around the close rather than reflecting the pivot outward. That is why intraday
traders reach for it and why it becomes useless on a quiet day: when the range is small, its levels sit
closer together than the spread you are paying.
So there is no correct method, and this page will not pick one for you. What it can tell you is
what each one does differently, which is in the table above and in the formula reference below. If your
levels do not match somebody else's, the first thing to check is which method they used, and the second
is whether your broker's trading day ends at the same hour as theirs.
The Formulas, With One Worked Example
Every line uses the same session as the table above, so you can follow one set of numbers all the way through.
| Method | Level | Formula | Worked out |
|---|---|---|---|
| Classic | Pivot | P = (H + L + C) ÷ 3 |
(1.1050 + 1.0950 + 1.1020) ÷ 3 = 1.10067 |
| Classic | R1 | R1 = (2 × P) − L |
(2 × 1.10067) − 1.0950 = 1.10633 |
| Classic | S1 | S1 = (2 × P) − H |
(2 × 1.10067) − 1.1050 = 1.09633 |
| Classic | R2 | R2 = P + (H − L) |
1.10067 + 0.0100 = 1.11067 |
| Classic | S2 | S2 = P − (H − L) |
1.10067 − 0.0100 = 1.09067 |
| Classic | R3 | R3 = H + 2 × (P − L) |
1.1050 + 2 × 0.00567 = 1.11633 |
| Classic | S3 | S3 = L − 2 × (H − P) |
1.0950 − 2 × 0.00433 = 1.08633 |
| Woodie | Pivot | P = (H + L + 2C) ÷ 4 |
(1.1050 + 1.0950 + 2.2040) ÷ 4 = 1.10100 |
| Woodie | R1 | R1 = (2 × P) − L |
(2 × 1.10100) − 1.0950 = 1.10700 |
| Woodie | S1 | S1 = (2 × P) − H |
(2 × 1.10100) − 1.1050 = 1.09700 |
| Camarilla | R1 | R1 = C + (H − L) × 1.1 ÷ 12 |
1.1020 + 0.0100 × 0.09167 = 1.10292 |
| Camarilla | R4 | R4 = C + (H − L) × 1.1 ÷ 2 |
1.1020 + 0.0100 × 0.55 = 1.10750 |
| Camarilla | S1 | S1 = C − (H − L) × 1.1 ÷ 12 |
1.1020 − 0.0100 × 0.09167 = 1.10108 |
| Fibonacci | Pivot | P = (H + L + C) ÷ 3 |
same centre as Classic = 1.10067 |
| Fibonacci | R1 | R1 = P + (H − L) × 0.382 |
1.10067 + 0.0100 × 0.382 = 1.10449 |
| Fibonacci | R2 | R2 = P + (H − L) × 0.618 |
1.10067 + 0.0100 × 0.618 = 1.10685 |
| Fibonacci | R3 | R3 = P + (H − L) × 1.000 |
1.10067 + 0.0100 = 1.11067 |
| DeMark | X, close > open | X = (2 × H) + L + C |
used when the session closed higher |
| DeMark | X, close < open | X = H + (2 × L) + C |
used when the session closed lower |
| DeMark | R1 and S1 | R1 = X ÷ 2 − L, S1 = X ÷ 2 − H |
one level each way, no ladder |
What These Levels Do and Do Not Mean
The parts that are easy to get wrong.
Key Features & Capabilities
What this calculator does, and what it deliberately does not.
About the Forex Pivot Point Calculator
A pivot point calculator turns three numbers into a set of horizontal lines. Give it the high, the low and the close of a completed period and it works out a central pivot and a ladder of supports and resistances around it, in whichever of five methods you choose. The arithmetic is simple enough to do on paper, which is worth knowing, and this page shows every formula with the same worked example so you can follow it.
The part usually left out is that the methods disagree. Classic, Woodie, Camarilla, Fibonacci and DeMark all take the same three prices and hand back different levels, sometimes a long way apart. That is not a flaw in any of them. They were designed by different people to do slightly different things, and the comparison table on this page exists so you can see the spread rather than assume the first set you found is the set.
It is also worth being clear about what a pivot level is. It is a number derived from three prices, and it carries no forecast. The reason these lines are watched at all is that a lot of traders plot the same ones, so a level can matter because of who is looking at it rather than because of anything in the market itself. This tool describes them as reference points throughout and never as signals, because that is what they are.
Everything runs in your browser. There is no broker connection, no price feed and no account, so the three prices you type are the only inputs and nothing is sent anywhere. That also means the tool is only as right as those three numbers: if the high, low or close came from a platform whose trading day ends at a different hour, every level below it will differ from someone else's, and no calculator can tell you which of you is looking at the right session.
Frequently Asked Questions
Everything worth knowing before you plot these lines.