


Free Online Bar Chart Race Maker & Data Animation Tools
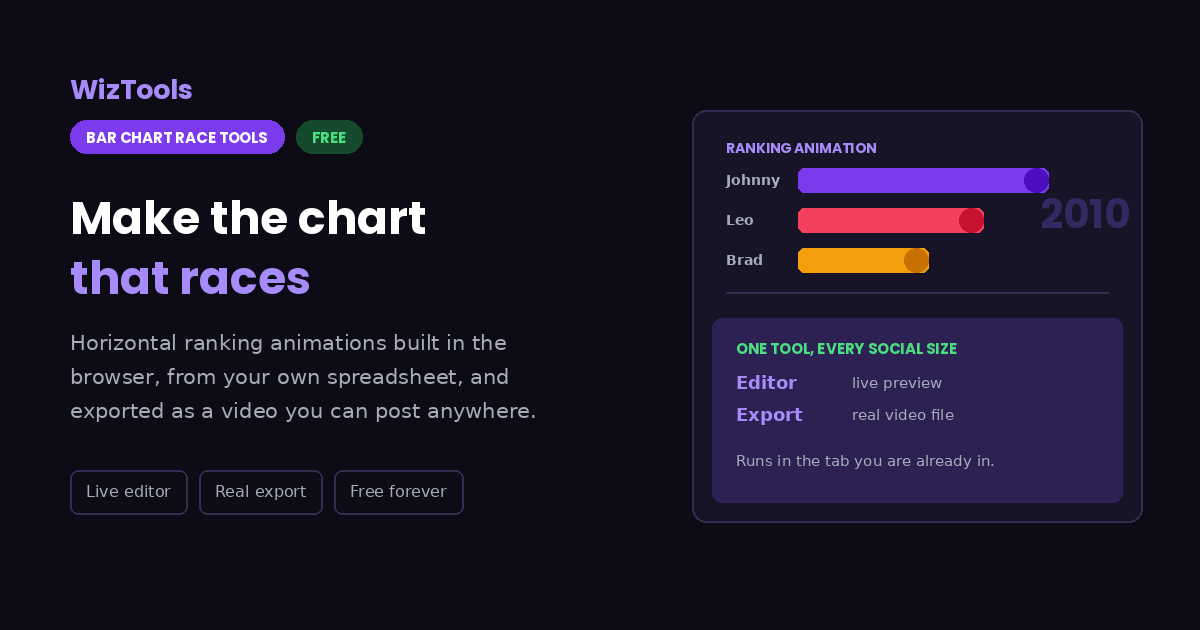
Tools that turn plain data into something worth watching. A bar chart race maker and a data-to-video studio that animate a spreadsheet and export a real MP4 for YouTube, Shorts, TikTok or Reels. More are on the way. Everything runs inside your own browser, so nothing is uploaded and nothing carries a watermark.
Tools in This Section
Every one of them runs in this tab. Nothing is uploaded anywhere.
Enjoying WizTools123? Help keep our server infrastructure 100% free and open for everyone.
Which Tool Do I Need?
Find the sentence that sounds like you.
| What you are trying to do | Tool | Why that one |
|---|---|---|
| I want the video where bars keep overtaking each other | Bar Chart Race Maker | That is the one animation it makes, so every setting on the page is about it. |
| I have a spreadsheet and I am not sure which chart suits it | Data-to-Video Studio | Thirteen chart types share one dataset, so you can look at one, switch, and keep your colours and titles. |
| I need a line or an area chart that draws itself over time | Data-to-Video Studio | Line, area and stacked area are there. The race maker only makes the ranking race. |
| I need a pie, donut, scatter or bubble chart | Data-to-Video Studio | All four are in the studio, drawn by the same renderer as everything else. |
| My numbers are in an Excel .xlsx workbook | Data-to-Video Studio | It reads .xlsx sheet by sheet, including dates Excel stores as numbers. The old .xls is not read by either tool. |
| I just want a finished race video as quickly as possible | Bar Chart Race Maker | It opens with a working race already loaded. Press play, then put your own numbers in the grid. |
| I want counters or comparison cards, not really a chart | Data-to-Video Studio | KPI counters, comparison cards and a timeline are chart types there too. |
| I need a wide cut and a vertical cut of the same thing | Bar Chart Race Maker | Both tools hold the layout in percentages, so the frame changes without the design being squeezed. Start here when the chart is a race. |
How These Tools Work
The same four steps, whichever one you open.
Why Make the Video Here
The things that are actually different, not a list of adjectives.
About WizTools Data & Creative Tools
Data does not travel well. A spreadsheet that took a week to assemble gets a glance, while the same numbers moving for twenty seconds get watched to the end. That is why animated charts took over YouTube, TikTok and Reels, and it is what the tools in this section are for: they take a table and give back a video file.
There are two of them, and the difference is easy to state. The Bar Chart Race Maker does one thing, the ranking race where horizontal bars keep overtaking each other, and every setting on that page is about that one animation. The Data-to-Video Studio is the wider one: thirteen chart types, including the race, sharing a single dataset, timeline and renderer, so you can try a line chart, look at it, and switch to bars without starting again.
Everything happens inside the tab you are already looking at. The file is parsed by your browser, the chart is drawn on a canvas by your own machine, and the video is encoded by an encoder compiled to run in the same page. Nothing is uploaded, so there is no queue to wait in, nothing to delete afterwards, and no reason for anyone to ask who you are. That is also why both tools keep working after you disconnect from the internet.
The part that took the most care is the part nobody sees. Every frame is worked out purely from the time on the clock, with no state carried between frames. That sounds academic until you scrub the timeline, stop somewhere and render: the frame in the file is exactly the frame you were watching. Tools that animate with springs and velocities cannot make that promise, and the difference shows up later as a video that does not match its own preview.
The honest trade is speed and scale. A browser draws and encodes more slowly than a desktop program, and every frame has to be drawn separately for the timing to survive. A short clip at half size is about a minute of waiting. A long one at 4K and 60 fps can be more than a browser tab will hold, and both tools warn you before you start rather than after ten minutes.
Some things are deliberately not here. There is no live data feed, no map chart, no scene system, no annotation layer and no voice-over. Music is mixed into the export but it is not trimmed or beat matched for you, and the old binary .xls format is not read. What is on these pages works; what is missing is said out loud rather than left as a control that does nothing.
Frequently Asked Questions
About this section in general. Each tool has its own answers too.
Every Other Category
17 more sets of tools on the site. All free, all in your browser.