Free Online ROI Calculator, Return Percent, Gain and the Annualised Rate
Measure the return on an investment. Enter what you put in and what it became to get the gain and the return as a percent. Add the number of years and it also gives the annualised rate, the figure that lets you compare a deal held for three years against one held for six. The two differ a lot, and the page shows why.
Free Forever Nothing Uploaded Annualised Too As You Type
Share this tool
Advertisement Slot (Top Banner)Google AdSense Unit • Responsive Banner
ROI CalculatorThe return, the gain, and the annualised rate.
Everything is worked out in your browser. No number you type is sent anywhere, and there is no account.
The investment
Nothing is uploaded; every number stays in your browser.
$
$
years
Add this for the annualised rate, which is how you compare deals.
Result
The save button in the top bar keeps the numbers you have filled in, on this device only.
Numbers
Display
Size
Theme
Full screen hides the page around the tool. Press Escape, or the button in the bar, to come back.
History
Your data
Settings, history and saved setups live in this browser and nowhere else. There is no account and no server, which also means clearing them here is final.
Are you sure?
Buy Us A Coffee
Enjoying WizTools123? Help keep our server infrastructure
100% free and open for everyone.
Total return and annual return are different animals.
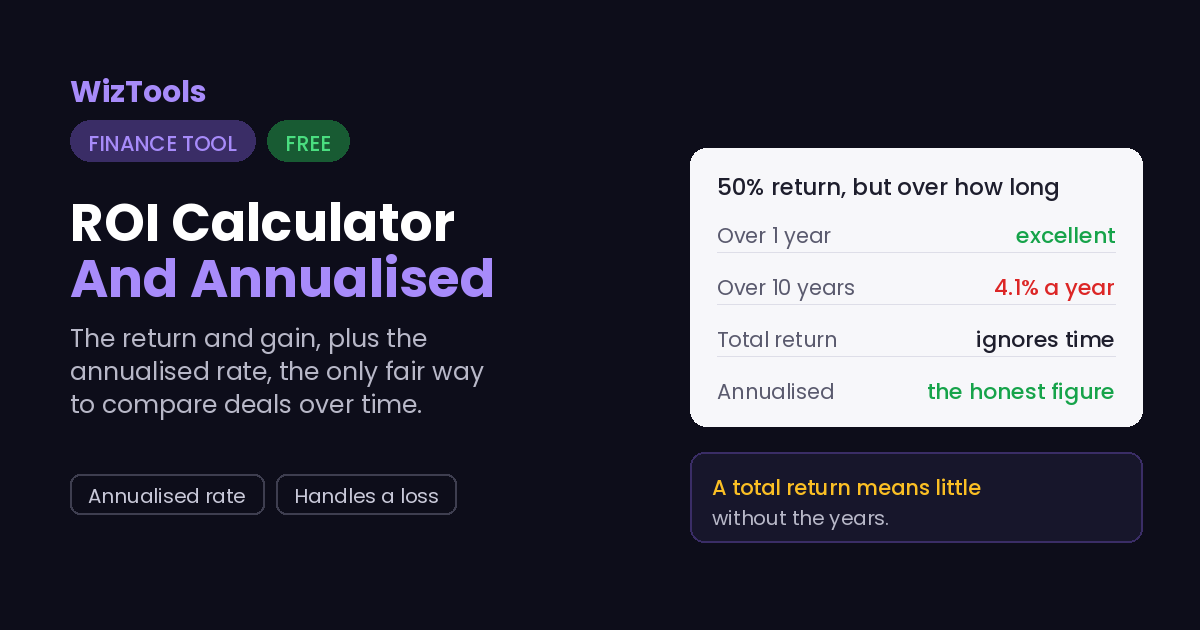
Fifty percent sounds like a good return, and it is, over one year. Over ten years it is poor,
about four percent a year. The plain return, final over initial, ignores time completely, so a
deal that doubled in two years and one that doubled in twenty look identical by it. The
annualised rate is what fixes this, and it is the only fair way to line two investments up.
Add the number of years and this works out the annualised rate for you. It is not the
total divided by the years, which would be too generous; it is the steady yearly rate that
compounds up to the same result, which is always lower. That compounding is why the annual
figure and the naive average diverge, and why the annual one is the honest headline.
This measures a return you have already had; it does not predict one. You give it what
you put in and what it became, both real figures, and it reports what happened. It fetches no
prices and forecasts nothing. It also does not subtract fees or tax, so for a true net return,
enter the amount after costs as the final value.
Where Your Input Goes
Nowhere. And you can check that yourself.
Your investment figures are worked out in your browser and never sent anywhere.
It is all done by your own browser. Press F12, open the Network tab, and use the tool:
the page fetches its own code and nothing else. Or load the page, turn off your wifi, and
carry on. It still runs, because there was never a server in the middle.
How to Calculate ROI
A few steps, and nothing is uploaded.
1
Enter what you put inThe amount invested. Nothing is uploaded.
2
Enter what it becameThe final value; for a net figure, use the amount after fees and tax.
3
Add the yearsOptional, but needed for the annualised rate that lets you compare.
4
Read the returnThe gain, the total return, and the annualised rate.
What to Know About Return on Investment
Including the things this tool cannot do.
Total return ignores time, so it can mislead. A 50% return is excellent in a year and poor over ten. The plain figure treats a two-year double and a twenty-year double the same. The annualised rate, which the tool gives once you add the years, is the only fair way to compare investments held for different lengths.
The annualised rate is not the total divided by the years. That would overstate it. It is the steady yearly rate that compounds to the same result, and it is always lower than the naive average. The gap between them is compounding, and it is why the annual figure is the honest headline.
This measures what happened; it does not predict. You enter real figures for what you put in and what it became, and it reports the return. No price is fetched and nothing is forecast. For a return on a future assumption, the SIP calculator here is the right tool.
Fees and tax are not removed. The tool takes your two numbers as given. For a true net return, enter the final value after costs and tax, so the figure reflects what you actually kept.
Key Features & Capabilities
What this tool does, and what it deliberately does not.
Return and gainThe total return as a percent and the gain in cash.
Annualised rateThe fair yearly figure for comparing deals, once you add the years.
Handles a lossA negative return is shown as such, not hidden.
As you typeThe result updates while you edit.
History and savedRecent calculations and named setups, on this device only.
Nothing uploadedYour figures stay in the browser.
About the ROI Calculator
Return on investment is the simplest measure of whether something paid off: what you put in against what it became. This calculator gives that as a percentage and a cash gain, and then does the part people forget, the annualised rate, which is the only figure that lets you compare investments held for different lengths of time.
The plain return has no sense of time. Doubling your money is a triumph in two years and mediocre over twenty, yet both are 100% by the simple measure. Add the number of years and the tool works out the steady annual rate that compounds to the same result, which is always lower than dividing the total by the years and is the honest number to quote.
It reports a return you have had, not one you might get. You enter two real figures and it tells you what happened; it fetches no prices and predicts nothing. Fees and tax are yours to fold in by entering the after-cost final value, and everything runs in your browser with nothing uploaded. For growth from an assumed future rate, use the SIP calculator instead.
Frequently Asked Questions
Why total return misleads, and what the annualised rate really is.
Total return is simply what it became over what you put in, ignoring time. Annualised return is the steady yearly rate that compounds to that result. A 50% total over ten years is only about 4% a year. Only the annualised figure lets you compare investments held for different periods.
No, that would overstate it. It accounts for compounding, so it is always a bit lower than the simple average. The tool computes it as the nth root of the growth factor once you enter the years.
No, it takes your two numbers as given. For a net return, enter the final value after fees and tax, so the result reflects what you actually kept rather than the gross.
No. It measures a return you have already had from real figures. For projecting growth from an assumed rate, use the SIP calculator, which is built for that and is honest that the rate is an assumption.
No. Your cost and your return are divided here in the page. History and saved setups stay in this browser, and the page works offline.
Every Other Finance & Loan Tool
9 more tools in this set. All free, all in your browser.