


Free Online Crypto Profit and Loss Calculator, Long, Short & Fees
Work out the profit or loss on a position before or after you close it. Long and short are both handled, fees on entry and exit are included, and the result appears in cash, as a percentage, and against the money you actually put in. Change one number and the whole answer follows.
This calculator provides mathematical estimates only and is not financial or investment advice. Everything is worked out locally in your browser.
Long position Profit and Loss
A long makes money when the price rises.
Short position Profit and Loss
A short makes money when the price falls.
Spot profit and loss
Bought and sold outright. No leverage, no funding.
Futures profit and loss
Margin, leverage, fees and funding together.
Leverage and margin
What a position costs to hold, and what it returns.
Return on investment
The same profit against four different bases.
Trading fees
What both sides of the trade cost.
Funding cost
What holding a perpetual costs, or pays.
Break-even price
The price that gets you back to level.
Target profit
The exit a chosen profit needs.
Maximum loss
The price at which a chosen loss happens.
Partial exit
Realised on what was sold, open on what is left.
Multiple exit targets
Scaling out across several prices. Each target counts by the share you allocate to it, not by a plain average.
| # | Target price | Allocation % | Quantity | Gross Profit and Loss | Net Profit and Loss | Remove |
|---|
Average entry and DCA
Several buys, one average, and the running profit or loss against a price you choose.
| # | Buy price | Quantity | Cost | Fee | Share of position | Remove |
|---|
Price scenarios
The same position across a range of prices. Hypothetical, and no price here is a forecast.
| Move | Price | Gross Profit and Loss | Fees | Net Profit and Loss | Profit and Loss % | ROI on margin |
|---|
Multiple positions
Several open trades added up: gross, fees, funding and net, each on its own line and then together.
| # | Asset | Side | Entry | Exit | Quantity | Leverage | Fee % | Funding | Net Profit and Loss | ROI | Remove |
|---|
Profit and Loss comparison
Different setups side by side. The largest net figure is marked, which is a statement about these numbers, not a recommendation.
| # | Setup | Side | Entry | Exit | Quantity | Fee % | Gross Profit and Loss | Net Profit and Loss | ROI | Remove |
|---|
| When | Calculator | Inputs | Result | Actions |
|---|
Calculator
Numbers
Rounding is only ever applied to what you see. The arithmetic underneath keeps full precision, which matters when a position is measured in satoshis.
Currency
A display unit only. No exchange rate is applied, so switching currency changes the symbol, not the numbers. Enter every figure in the currency your account is held in.
Results
Hiding a line only hides it. Fees and funding are still taken off the net figure, because the switches change what is on screen, never what is counted.
Appearance
History
Your data
Settings, history and saved calculations are stored only in this browser. Nothing is uploaded, and this tool has no field for a wallet address, an API key, a private key or a seed phrase. Never type one into any calculator.
Enjoying WizTools123? Help keep our server infrastructure 100% free and open for everyone.
How to Use the Profit and Loss Calculator
Five steps, and the last one is the one people skip.
Long or short. A long profits when the price rises, a short when it falls, and everything below flips with this one choice.
The exit can be a price you actually got, or the current price if the trade is still open. The tool labels which of the two you are looking at.
In units of the coin. If you know the position value instead, enter that and the quantity is worked back from the entry price.
Both sides of the trade are charged, and a perpetual is charged for every period you hold it. Leave them empty for a clean gross figure.
Price change, position Profit and Loss, ROI on margin and account impact are four different questions. The summary keeps them apart on purpose.
Why Your PnL Looks Wrong
One trade: a 10,000 position at 10× on a 5,000 account, with 0.05% fees each way and 6 of funding.
| Price move | Gross | Costs | Net | On position | On margin | On account |
|---|---|---|---|---|---|---|
| +5% | 500.00 | 16.25 | 483.75 | 4.84% | 48.38% | 9.68% |
| -5% | -500.00 | 15.75 | -515.75 | -5.16% | -51.58% | -10.32% |
Price change
Measured against the entry price
How far the asset itself moved. Nothing to do with your position size or your leverage.
Position Profit and Loss
Measured against the position value
Your profit against what the whole position was worth. On an unleveraged trade this matches the price change.
ROI on margin
Measured against the initial margin
Your profit against the money you actually put up. Leverage moves this figure and only this figure.
Account impact
Measured against the account balance
What the trade did to your whole account. Usually the smallest of the four, and the one that matters most.
Both rows are the same trade and the same 5% move, and every percentage in them is correct. That is the
whole problem. Your exchange usually shows the biggest one, the return on margin, while the number in your
head is the price change, and at 10× those sit ten times apart.
Then look at what the costs did. A 5% move should have made
500, and
483.75 arrived. The same move against you took
515.75, because the fees are charged going in and
coming out whichever way the price went. A winner and a loser of identical size are not identical, and on
small moves that gap is the difference between a profitable month and a flat one.
The Formulas, Step by Step
One long from $100 to $110 on 10 units, 0.1% each way, $1 of funding, at 10×, worked all the way through.
| Figure | Formula | Worked example |
|---|---|---|
| Long Profit and Loss | (Exit Price − Entry Price) × Quantity |
($110 − $100) × 10 = +$100 |
| Short Profit and Loss | (Entry Price − Exit Price) × Quantity |
($100 − $90) × 10 = +$100 |
| Entry position value | Entry Price × Quantity |
$100 × 10 = $1,000 |
| Exit position value | Exit Price × Quantity |
$110 × 10 = $1,100 |
| Price change | Exit Price − Entry Price |
$110 − $100 = $10 |
| Price change % | (Exit Price − Entry Price) ÷ Entry Price × 100 |
$10 ÷ $100 × 100 = +10% |
| Entry fee | Entry Position Value × Entry Fee % |
$1,000 × 0.1% = $1.00 |
| Exit fee | Exit Position Value × Exit Fee % |
$1,100 × 0.1% = $1.10, larger because the position grew |
| Total fees | Entry Fee + Exit Fee + Fixed Fees |
$1.00 + $1.10 = $2.10 |
| Funding cost | Position Value × Funding Rate × Periods |
$1,000 × 0.01% × 10 = $1.00 |
| Net Profit and Loss | Gross Profit and Loss − Total Fees − Funding Cost |
$100 − $2.10 − $1.00 = +$96.90 |
| Initial margin | Position Value ÷ Leverage |
$1,000 ÷ 10 = $100 |
| Position value from margin | Margin × Leverage |
$100 × 10 = $1,000 |
| Quantity from value | Position Value ÷ Entry Price |
$1,000 ÷ $100 = 10 units |
| Position Profit and Loss % | Net Profit and Loss ÷ Entry Position Value × 100 |
$96.90 ÷ $1,000 × 100 = +9.69% |
| ROI on margin % | Net Profit and Loss ÷ Initial Margin × 100 |
$96.90 ÷ $100 × 100 = +96.9%, same dollars, tenth of the base |
| Account impact % | Net Profit and Loss ÷ Account Balance × 100 |
$96.90 ÷ $10,000 × 100 = +0.97% |
| Break-even price (long) | (Entry Cost + Costs) ÷ (Quantity × (1 − Exit Fee %)) |
$1,002 ÷ (10 × 0.999) = $100.30 |
| Break-even price (short) | (Entry Proceeds − Costs) ÷ (Quantity × (1 + Exit Fee %)) |
$998 ÷ (10 × 1.001) = $99.70 |
| Weighted average exit | Σ (Exit Price × Allocation) ÷ Σ Allocation |
$105×25% + $110×25% + $120×50% = $113.75 |
| Average entry price | Total Cost ÷ Total Quantity |
$100×10 + $90×20 + $80×30 = $5,200 ÷ 60 = $86.67 |
The Same Profit, Four Different Percentages
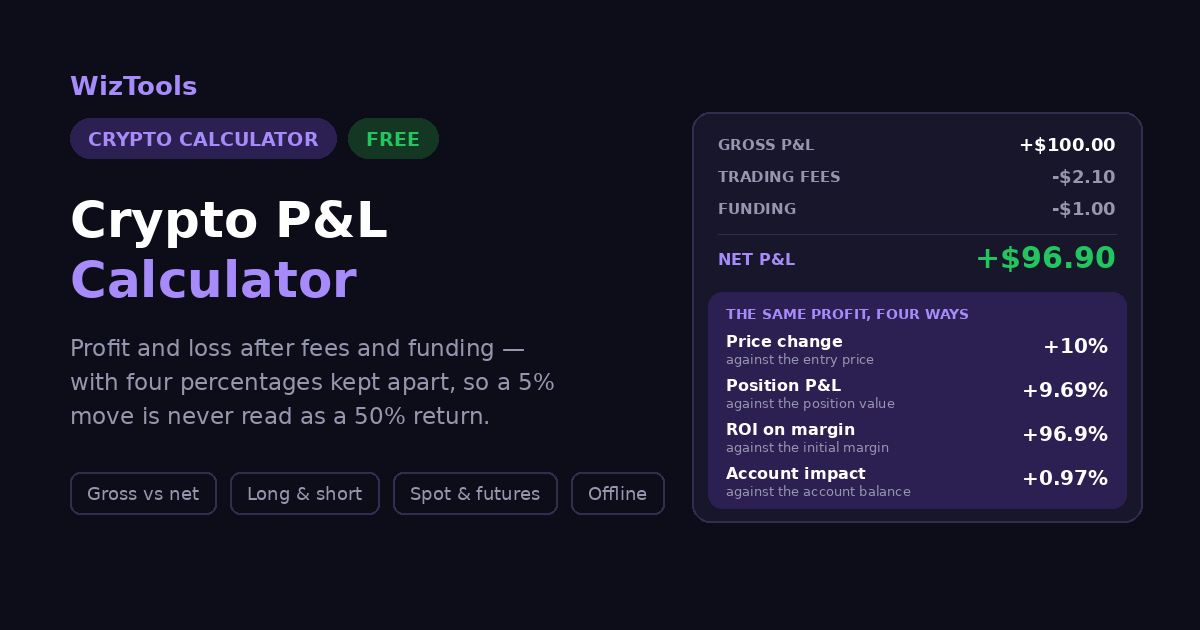
$96.90 net on a $1,000 position, held at 10× with $100 of margin, in a $10,000 account. Every figure below is correct.
| Measurement | Measured against | Here it is | What it actually tells you |
|---|---|---|---|
| Price change | the entry price | +10% | How far the asset itself moved. Nothing to do with your position size or your leverage. |
| Position Profit and Loss | the position value | +9.69% | Your profit against what the whole position was worth. On an unleveraged trade this matches the price change. |
| ROI on margin | the initial margin | +96.9% | Your profit against the money you actually put up. Leverage moves this figure and only this figure. |
| Account impact | the account balance | +0.97% | What the trade did to your whole account. Usually the smallest of the four, and the one that matters most. |
The dollars never changed. Only the question did. A trade that is "up 96.9%" and a trade that moved the account by less than one per cent can be, and here are, the same trade.
What This Calculator Will Not Tell You
The limits are part of the tool, not the small print.
What This Tool Does
The fee and funding lines sit between the two, so the gap is always visible rather than quietly folded into one number.
Price change, position Profit and Loss, ROI on margin and account impact each get their own row and their own base.
A falling price producing a profit is handled properly, including in the scenario table and the chart.
Spot has no leverage and no funding. Futures adds margin, funding and the return on margin.
Break-even price, the exit a target profit needs, and the price at which a chosen loss happens, all with fees included.
No account, no request, no price feed. Settings and history are kept in this browser and can be cleared in one click.
About the Crypto Profit and Loss Calculator
Profit and loss on a crypto trade is simple arithmetic: the price moved, you held some quantity, and the difference is yours either way. Long or short only decides which direction pays. If that were the whole story this page would be one input box and one line of output.
It is not the whole story, and the reason is percentages. The same profit can honestly be described as a 5% move, a 5% return on the position, a 50% return on margin and a 0.5% change in your account, all at once, all true, and all measured against something different. Confusing them is not a rounding error; it is how a modest move starts to feel like a life-changing one, and how a modest loss does the same in the other direction. This calculator shows all four separately and never picks one to call "the" percentage.
The second thing that gets lost is cost. Fees are charged going in and coming out, funding is charged for every period a perpetual is held, and none of it is optional. A gross figure that ignores them looks better and is worth less. Here the gross number, the fee line, the funding line and the net number all appear together, so the gap between what the price did and what you kept is impossible to miss.
Everything runs in your browser. No price is fetched, nothing is sent anywhere, and no account is needed, which also means the numbers are only as good as what you type, and that real fills differ because of slippage, mark price, contract specifications and exchange rules this page has no view of. It is a calculator for planning and for checking your own arithmetic, not a statement of your account.
Frequently Asked Questions
Related Tools
Every Other Crypto Tool
11 more tools in this set. All free, all in your browser.